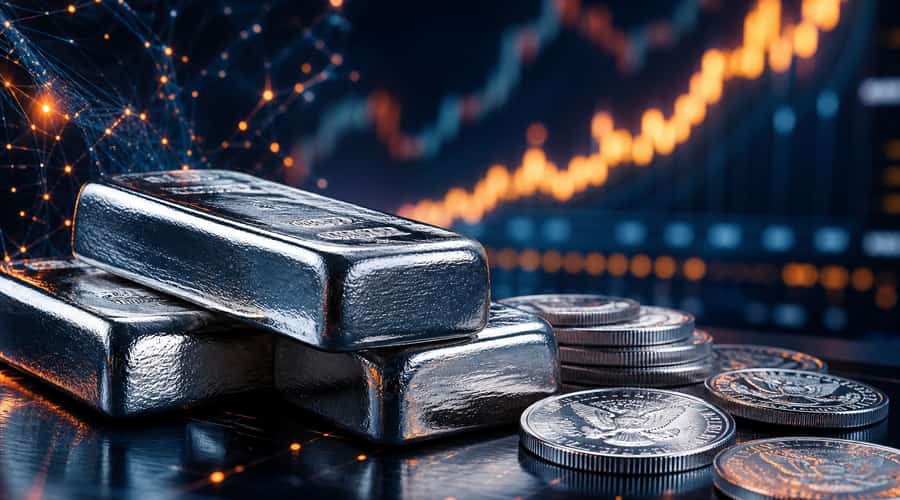
Silver prices in 2026 have pushed closer to the $50 per troy ounce barrier than at any point since 2011, reviving a question the market has deferred twice before: can this rally finally do what the Hunt brothers and the post-crisis commodity boom could not?
Forty-seven years is a long time to hold a ceiling. The nominal all-time high for silver, set somewhere between $49.45 and $50 per troy ounce in January 1980, has survived two serious challenges and countless smaller ones. It survived the spectacular collapse of Nelson Bunker Hunt and Herbert Hunt, whose attempt to corner the silver market ended when commodity regulators changed margin rules and the price fell off a cliff. It survived the April 2011 run to $49.51, when post-financial-crisis monetary expansion and broad commodity inflation brought silver within pennies of the mark before sentiment reversed sharply. As of April 2026, the ceiling is being tested again, and the setup looks different from either of those episodes.
The current rally is not the product of a single speculative actor or a single macro theme. Industrial demand has been a persistent and growing floor under the price. Silver is a critical input for photovoltaic cells used in solar panels, and the global energy transition has made that demand structural rather than cyclical. Manufacturers cannot easily substitute away from silver in high-efficiency solar applications, which means the industrial bid does not evaporate the way speculative futures positioning does. That dynamic was largely absent in 1980 and only partially present in 2011.
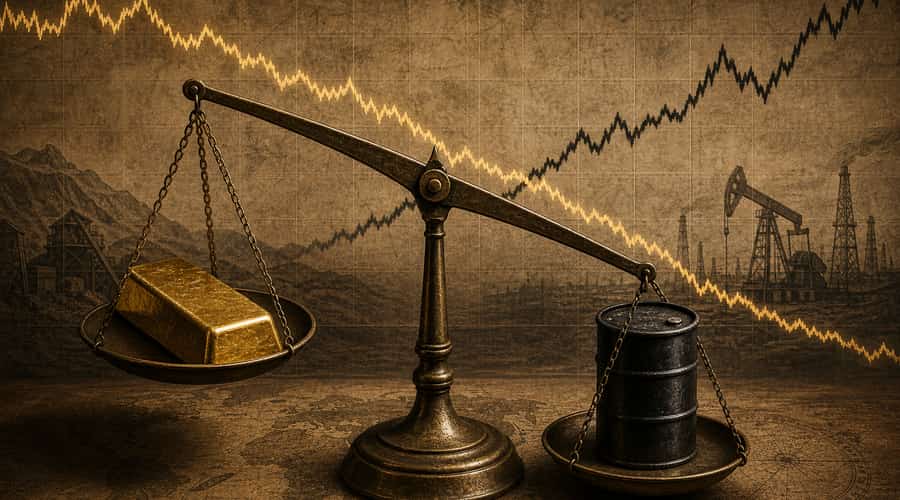
Precious metals investors have been watching the gold-to-silver ratio compress after years of historically elevated readings. When gold prices rise and silver lags, the ratio widens, which many in the market read as silver being undervalued relative to its monetary peer. As that ratio has begun tightening in 2026, institutional money has rotated toward silver, adding a speculative and allocation-driven bid on top of the industrial demand base. ETF vehicles like the iShares Silver Trust have seen renewed inflows as that narrative gains traction.
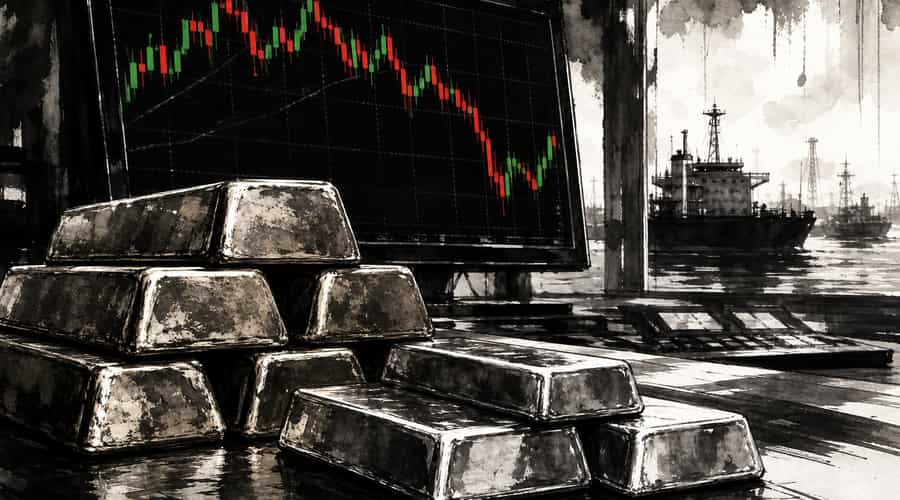
The physical supply picture is tightening the equation further. Silver production is concentrated in a handful of countries, with Mexico, Peru, and Chile accounting for a substantial share of global mining output. Permitting timelines, labor costs, and the fact that silver is often extracted as a byproduct of base metal mining mean supply cannot simply scale to meet demand spikes. When mine operators in those regions face disruptions or when base metal economics shift, silver supply takes the hit without a clean mechanism for rapid correction.
What a Sustained Break Would Actually Mean
Market participants are careful to distinguish between touching $50 and breaking it with conviction. Silver has come close before and retreated. A sustained close above that level, particularly on high volume and without an immediate reversal, would be technically significant enough to trigger momentum-driven buying from systematic traders who operate on breakout signals. It would also draw media attention well outside the specialist precious metals community, potentially bringing retail inflows that further accelerate the move.
The monetary context matters too. Central bank policy uncertainty, persistent inflation in parts of the global economy, and questions about dollar credibility have kept both gold and silver in demand as stores of value. Silver sits at an interesting intersection: it benefits from safe-haven buying the way gold does, but it also benefits from industrial growth the way copper does. In an environment where neither the inflation story nor the growth story is cleanly resolved, that dual nature is an asset rather than a complication.
Whether 2026 is the year the ceiling finally breaks or becomes the third failed attempt is still an open question. What is not open is that the conditions generating this rally, energy transition demand, supply constraints, monetary uncertainty, and ratio compression, are more structurally grounded than the forces behind either 1980 or 2011. If the level holds again, the retreat may be shallower. If it breaks, the move above it could be sustained in a way the previous runs were not. Either outcome will tell the market something it has been waiting 47 years to know.
Also read: Silver coin prices have surged to levels that are catching everyday buyers completely off guard • Silver coin prices have surged to levels that are catching everyday buyers completely off guard • The Royal Canadian Mint's 5 oz Silver Maple is quietly becoming the go-to bullion format for serious stackers